삼각함수의 정리
- 작성자
- 고친과정
2008년 어느날 : 처음씀
2023년 8월 5일 : 내용 보강 및 활용예시 추가
1.1. 개요
삼각함수(三角函數, trigonometric functions, angle functions, circular functions, goniometric functions) 란 각(θ)의 크기를 삼각비로 나타내는 함수라고 정의할 수 있습니다.
핵심 : 삼각함수는 각(θ) 에 대한 원의 반지름 r일 때 r을 빗면으로 하는 직각 삼각형의 변의 비를 의미한다는 점을 염두하고 위/아래 그림을 참고하여 함께 봐주세요.
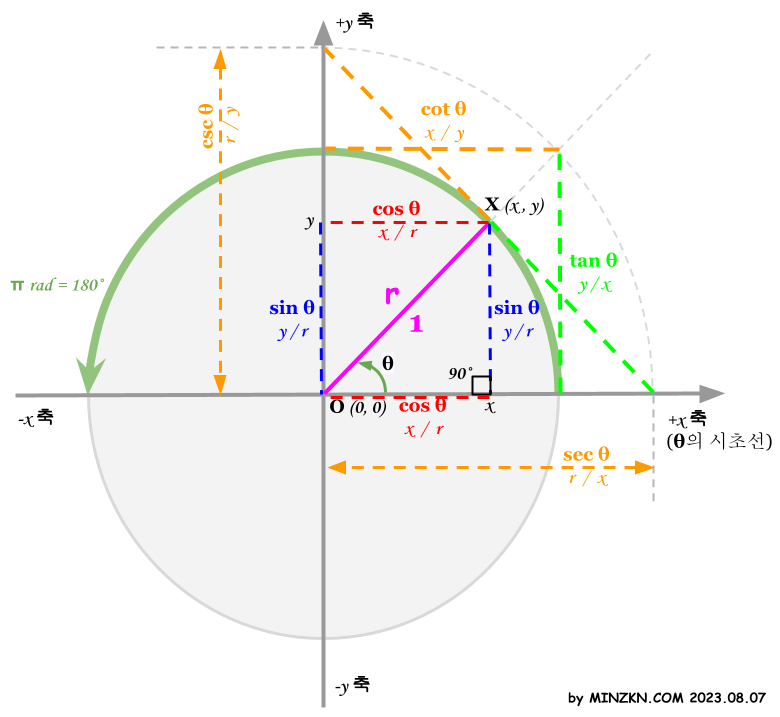
위 그림에서 원의 중심 O(좌표 0, 0)와 반지름 r만큼 떨어진 X점(좌표 x, y)을 이은 선 OX가 있을 때 x축으로부터 각의 크기 θ에 대한 주요 삼각 함수는 다음을 의미합니다.
| 참고 영상 |
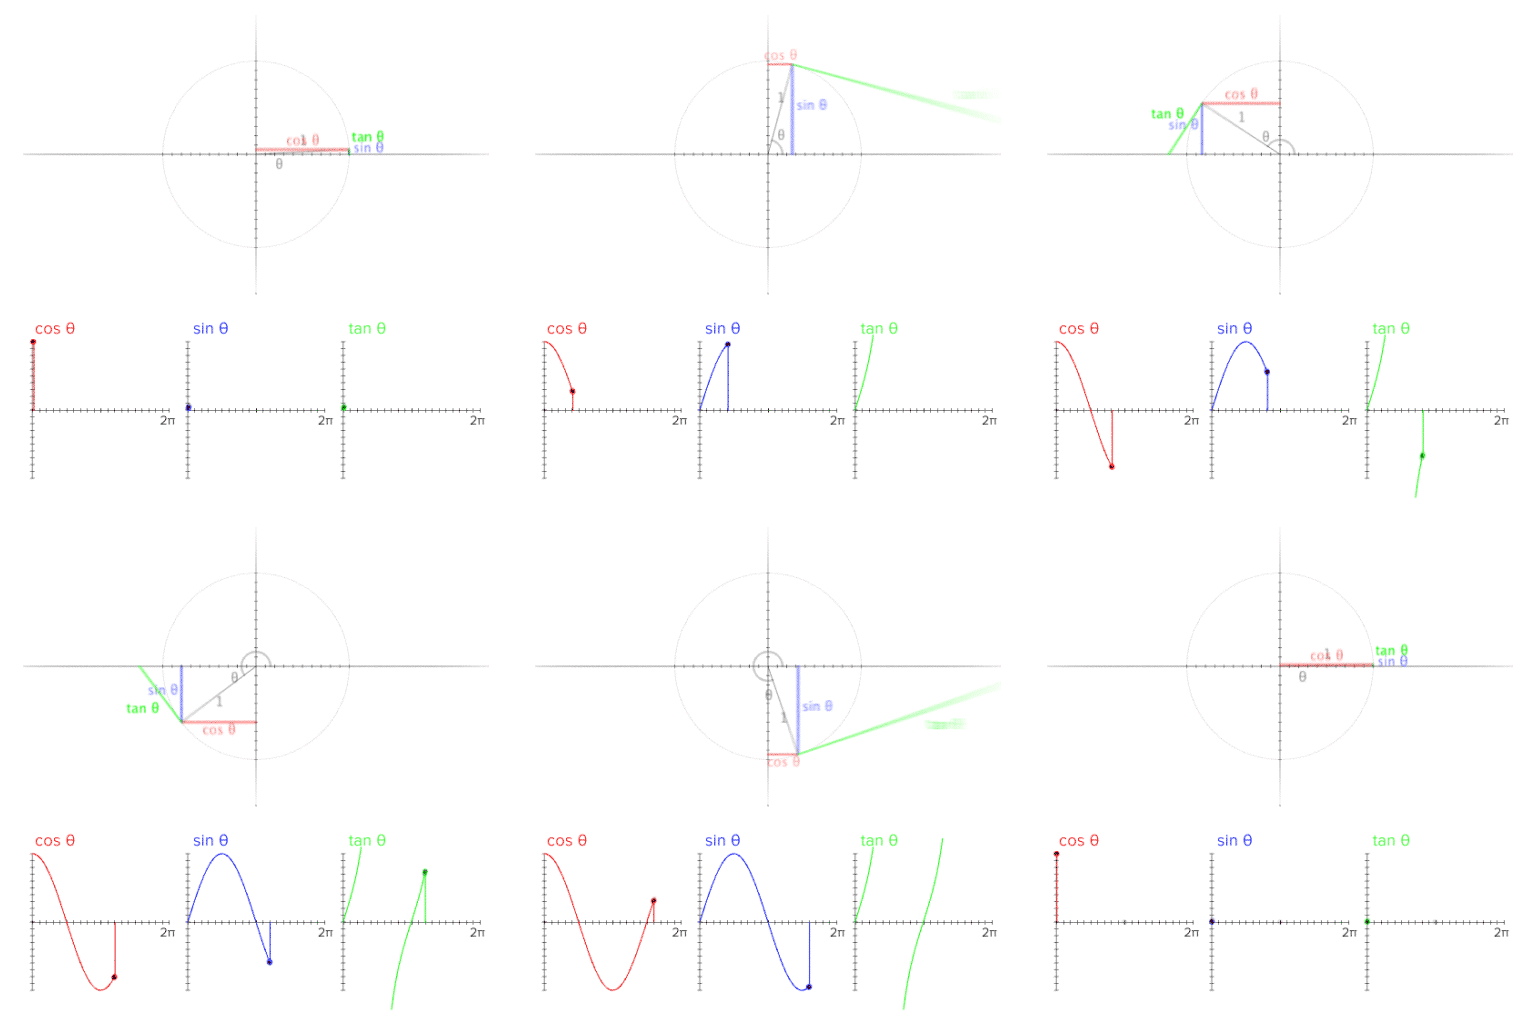 [GIF image (523.48 KB)] |
핵심 : 삼각함수는 각(θ) 에 대한 원의 반지름 r일 때 r을 빗면으로 하는 직각 삼각형의 변의 비를 의미한다는 점을 염두하고 위/아래 그림을 참고하여 함께 봐주세요.
 y / r = sin(θ)
 x / r = cos(θ)
 y / x = tan(θ)
- 여기서 반지름 r=1 일 때 '단위원'이라고 하는데 이 기준에서 생각하고 보시면 더 수월합니다.
- 어차피 r은 0을 제외[1]하고 어떤 값으로 변경하여도 r을 빗면으로 하는 변과의 비는 달라지지 않기 때문입니다. 즉, 동일한 각(θ)을 갖는 크기가 다른 닮은 꼴 삼각형의 삼각비는 동일하다는 것에 기인하여 r이 1일 때 기준으로 생각해도 다르지 않다는 것입니다.
- 각(θ)에 대한 단위 중에서 radian은 '단위원' 에서의 호(arc)의 길이(r 에 따른 호의 길이 비율기준 값)를 의미한다는 점도 뒤에 이해가 필요합니다.
- 원의 둘레 길이는 각(θ)이 360˚일 때 호(arc)의 길이는 2πr이라는 점. 이 때 각(θ)은 2πr에서 r=1 인 기준에서 2π rad = 360˚ 으로써 radian과 60분법(degree) 단위간의 관계를 이해해야만 합니다.
- sin과 cos은 여각[2]의 관계성이 있으며 다른 말로 한다면 위상차가 90˚라는 것.

[PNG image (59.78 KB)]
위 그림에서 원의 중심 O(좌표 0, 0)와 반지름 r만큼 떨어진 X점(좌표 x, y)을 이은 선 OX가 있을 때 x축으로부터 각의 크기 θ에 대한 주요 삼각 함수는 다음을 의미합니다.
| 기호 표기 | 정의 식 | 비고 |
| sin(θ) | y / r | sine, 사인 |
| cos(θ) | x / r | cosine, 코사인, '여각(餘角, complementary angle)의 sin' |
| tan(θ) | sin(θ) / cos(θ) = y / x | tangent, 탄젠트 |
| csc(θ) | 1 / sin(θ) = r / y | cosecant, 코시컨트, sin(θ)의 역수 |
| sec(θ) | 1 / cos(θ) = r / x | secant, 시컨트, cos(θ)의 역수 |
| cot(θ) | 1 / tan(θ) = x / y | cotangent, 코탄젠트, tan(θ)의 역수 |
| arcsin(x) | x = sin(θ)일 때 arcsin(x) = θ | 아크 사인, x = sin(θ)의 역함수 |
| arccos(x) | x = cos(θ)일 때 arccos(x) = θ | 아크 코사인, x = cos(θ)의 역함수 |
| arctan(x) | x = tan(θ)일 때 arctan(x) = θ | 아크 탄젠트, x = tan(θ)의 역함수 |
- "r² = x² + y²" 조건 (r, x, y 가 직각 삼각형의 변이라는 것)
- sin, cos, csc, sec는 주기가 2π rad (= 360˚)인 주기함수입니다.
- 즉, sin을 예로 들면 'sin(θ) = sin(360˚ * n + θ)' 에서 n 은 어떠한 정수 값에서도 동일한 삼각비가 됩니다.
- tan, cot는 주기가 π rad (= 180˚)인 주기함수입니다.
- 즉, tan을 예로 들면 'tan(θ) = tan(180˚ * n + θ)' 에서 n 은 어떠한 정수 값에서도 동일한 삼각비가 됩니다.
- csc, sec, cot 는 sin, cos, tan 의 역수 관계입니다.
- sin, cos, tan 는 각(θ)을 비(단위원에서의 변)로 대응하는 삼각비에 대한 함수인 반면 arcsin, arccos, arctan는 비(단위원에서의 변)를 각(θ, 호도법에서는 단위원에서의 호의 길이를 의미)으로 대응하는 역함수입니다.
- 삼각비에 대응하는 각(θ)는 무한히 존재합니다. 때문에 역 함수를 만들기 위해 θ는 적당한 범위로 제한이 필요합니다. (π/2 rad, π rad, 2π rad, 90˚, 180˚, 360˚ 등을 넘지 않는 제한을 하는 경우가 많겠죠.)
1.2. 호도법과 60분법
각도 θ는 호도법(radian, 弧度, Circular Measure) 과 60분법(degree, 六十分法, Sexagesimal System, 360도법)으로 각각 표시할 수 있으며 둘 간의 관계는 다음과 같습니다.
필자 의견: 보통 컴퓨터 수학에서 각도 θ는 호도법(radian, 弧度, Circular Measure) 이 유용한 경우가 많습니다만, 어떤 좌표에 대한 시간에 따른 회전좌표를 계산할 때는 60분법(degree, 六十分法, Sexagesimal System, 360도법)이 유용한 경우가 있다고 생각됩니다.
- 호도법(radian, 弧度, Circular Measure)
- 라디안(radian) 또는 호도(弧度)는 각의 크기를 재는 SI 유도 단위이며 기호는 rad 또는 c로 표기할 수 있으나 생략되는 경우가 많습니다.
- 반지름이 r > 0 일 때 주어진 각에 대한 호의 길이를 l(소문자 L) 이라고 하면 원주율(圓周率, π)은 모든 원에 대하여 일정하므로, 호의 길이 l과 반지름 r의 비는 l / r 이며 이것을 라디안(radian) 값으로 정의합니다.
- 즉, 반지름 r = 1 인 단위원에서 호(arc)의 길이라고 볼 수 있습니다.
- 60분법(degree, 六十分法, Sexagesimal System, 360도법)
- 원 한바퀴를 360도(˚)으로 나누어 표현하는 것을 60분이라고 합니다.
- 360도(˚)법이라고 불러도 좋지만, 60분법이라고 부르는 이유는, 1도(˚)를 60분으로 나누기 때문입니다.
- 1도(degree, ˚)는 60분(minute)입니다.
- 1도(degree, ˚)는 60분(minute)입니다.
| 60분법 | 0˚ | 30˚ | 45˚ | 60˚ | 90˚ | 180˚ | 270˚ | 360˚ |
| 호도법 | 0 | π / 6 | π / 4 | π / 3 | π / 2 | π | 3π / 2 | 2π |
필자 의견: 보통 컴퓨터 수학에서 각도 θ는 호도법(radian, 弧度, Circular Measure) 이 유용한 경우가 많습니다만, 어떤 좌표에 대한 시간에 따른 회전좌표를 계산할 때는 60분법(degree, 六十分法, Sexagesimal System, 360도법)이 유용한 경우가 있다고 생각됩니다.
1.3. 덧셈정리
sin(x + y) = sin(x) * cos(y) + cos(x) * sin(y)
sin(x - y) = sin(x) * cos(y) - cos(x) * sin(y)
cos(x + y) = cos(x) * cos(y) - sin(x) * sin(y)
cos(x - y) = cos(x) * cos(y) + sin(x) * sin(y)
tan(x + y) = (tan(x) + tan(y)) / (1 - tan(x) * tan(y))
tan(x - y) = (tan(x) - tan(y)) / (1 + tan(x) * tan(y))
1.4. 배각정리
sin(2 * x) = 2 * sin(x) * cos(x)
cos(2 * x) = cos²(x) - sin²(x) = 2 * cos²(x) - 1 = 1 - 2 * sin²(x)
tan(2 * x) = (2 * tan(x)) / (1 - tan²(x))
1.5. 반각의 정리
sin²(x / 2) = (1 - cos(x)) / 2
cos²(x / 2) = (1 + cos(x)) / 2
tan²(x / 2) = (1 - cos(x)) / (1 + cos(x))
1.6. 삼각함수 공식 총괄정리
sin(-θ)=-sinθ, cos(-θ)=cosθ, tan(-θ)=-tanθ
sin²θ+cos²θ=1, sec²θ-tan²θ=1, csc²θ-cot²θ=1               // 사인의 제곱과 코사인의 제곱의 합은 1 (피타고라스의 정리에 의한 항등식)
sin(π/2-θ)=cosθ, sin(π/2+θ)=cosθ, sin(θ±π/2)=±cosθ
cos(π/2-θ)=sinθ, cos(π/2+θ)=-sinθ, cos(θ±π/2)=Ŧsinθ
sin(π-θ)=sinθ, sin(π+θ)=-sinθ, sin(θ±π)=-sinθ
cos(π-θ)=-cosθ, cos(π+θ)=-cosθ, cos(θ±π)=-cosθ
sin(α±β)=sinαcosβ±cosαsinβ, cos(α±β)=cosαcosβŦsinαsinβ
tan(α+β)=tanα+tanβ/1-tanαtanβ, tan(α-β)=tanα-tanβ/1+tanαtanβ
sin2θ=2sinθcosθ
cos2θ=cos²θ-sin²θ=2cos²θ-1=1-2sin²θ, tan2θ=2tanθ/1-tan²θ
sin²θ/2=1-cosθ/2, cos²θ/2=1+cosθ/2, tan²θ/2=1-cosθ/1+cosθ
sinαcosβ=1/2{sin(α+β)+sin(α-β)}
cosαcosβ=1/2{cos(α+β)+cos(α-β)}
sinαsinβ=-1/2{cos(α+β)-cos(α-β)}
sinα+sinβ=2sin(α+β/2)cos(α-β/2)
sinα-sinβ=2cos(α+β/2)sin(α-β/2)
cosα+cosβ=2cos(α+β/2)cos(α-β/2)
cosα-cosβ=-2sin(α+β/2)sin(α-β/2)
1.7. 삼각함수의 구현
- 아래 python 구현으로 sin, cos, tan 를 각각 하나의 좌표 평면에 그래프로 표현
import numpy as np import matplotlib.pyplot as plt s_x = np.arange(-4, 4, 0.1) s_y1 = np.sin(s_x) s_y2 = np.cos(s_x) s_y3 = np.tan(s_x) plt.figure(figsize=(16, 10)) plt.plot(s_x, s_y1, 'r-', label='sin') plt.plot(s_x, s_y2, 'b-', label='cos') plt.plot(s_x, s_y3, 'm--', label='tan') # 여기서 tan 는 'mo' 속성으로 그리는게 더 좋을수도... plt.xlabel('x') plt.ylabel('y') plt.ylim(-2.0, 2.0) plt.axvline(x=0, color='k') plt.axhline(y=0, color='k') plt.title('sin/cos/tan function') plt.legend() plt.show()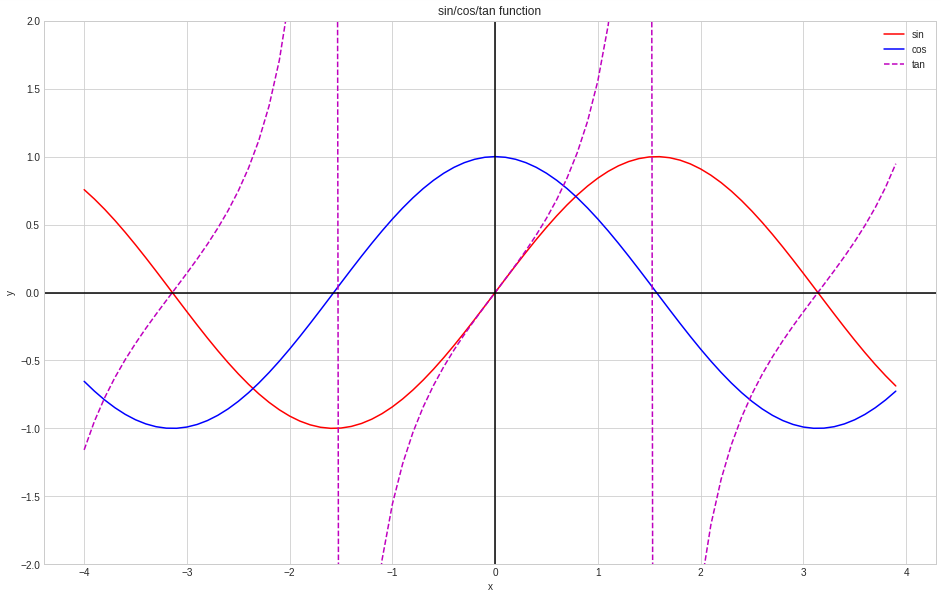 [PNG image (55.73 KB)]
 - 아래 python 구현으로 sin과 cos을 혼합하여 x, y, z축 3차원 그래프 표현
import numpy as np import matplotlib.pyplot as plt x = np.arange(-20, 20, 0.1) y = np.sin(x) z = np.cos(x) fig = plt.figure(figsize=(16, 10)) ax = fig.add_subplot(111, projection='3d') ax.set_title("Helix test", size = 20) ax.set_xlabel("x", size = 14) ax.set_ylabel("y", size = 14) ax.set_zlabel("z", size = 14) ax.plot(x, y, z)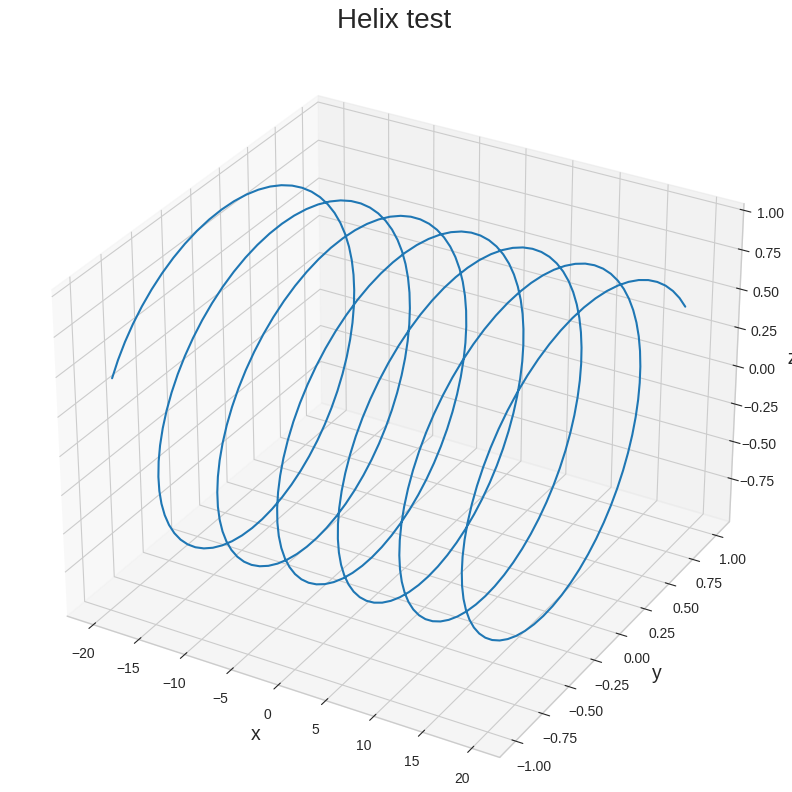 [PNG image (155.08 KB)]
 - C 로 구현한 sin 함수
- C source 보기
1.8. 삼각함수의 활용 예
1.8.1. 3차원 좌표계에서 각 x, y, z 축을 기준으로 회전하는 좌표계산의 예
문제: 3차원 좌표계에서 주어진 점(x,y,z) 좌표를 각각 x축, y축, z축을 기준으로 θ각 만큼 회전시킨 점(x',y',z') 좌표를 구하기
참고) 2차원 평면상의 좌표 x, y 에 대한 회전은 다음과 같은 공식에 의해서 변환됩니다.
각각의 축을 기준으로 회전각 θ에 따른 점(x',y',z') 좌표는 다음과 같이 계산할 수 있겠습니다. (참고: 3차원 그래픽)
참고) 2차원 평면상의 좌표 x, y 에 대한 회전은 다음과 같은 공식에 의해서 변환됩니다.
 [PNG image (84.28 KB)] |
이미지 출처: ![[https]](/moniwiki/imgs/https.png) 광속의 신비 — 광속은 왜 불변일까? 광속의 신비 — 광속은 왜 불변일까?![[]](/moniwiki/imgs/moni2/external.png) 영상에서 16:12 시점 영상에서 16:12 시점 |
각각의 축을 기준으로 회전각 θ에 따른 점(x',y',z') 좌표는 다음과 같이 계산할 수 있겠습니다. (참고: 3차원 그래픽)
- z축 회전공식 (Front)
x' = (x * sin(θ)) - (y * cos(θ))
y' = -((x * cos(θ)) + (y * sin(θ)))
- x축 회전공식 (Side)
y' = (y * sin(θ)) - (z * cos(θ))
z' = -((y * cos(θ)) + (z * sin(θ)))
- y축 회전공식 (Top)
* z' = (z * sin(θ)) - (x * cos(θ))
* x' = -((z * cos(θ)) + (x * sin(θ)))
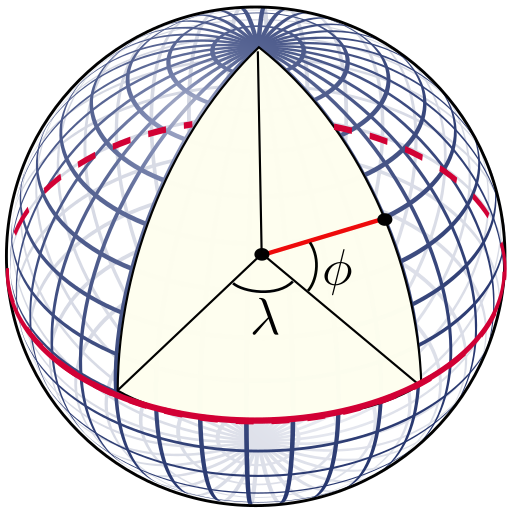
1.8.2. WGS84 좌표로 이루어진 두 좌표간의 거리를 미터(m)단위로 변환의 예
문제: A지점과 B지점의 WGS84 좌표(위도와 경도)를 입력으로 받아 두 지점의 거리를 미터(m)단위로 변환
먼저 π rad = 180˚ 관계를 이용하여 degree 좌표를 radian으로 변환할 수 있습니다. (참고: 비율계산)
A와 B 지점의 위도 좌표를 각각 radian 으로 변환하려면 다음과 같이 할 수 있습니다.
A와 B 지점의 경도 좌표의 각 차이를 radian 으로 변환하려면 다음과 같이 할 수 있습니다. (위도와 경도의 나누는 기준이 다르다는 것을 이해할 필요 있습니다.)
두 지점간의 비(단위원에서의 변)를 구합니다.
이제 비(단위원에서의 변)을 실제 '지구의 둘레'에 비례하는 각(호, arc, radian)로 계산합니다. (arccos 을 사용하여 arccos의 결과값의 단위는 radian이어야 단위원에서의 호의 길이가 되겠죠.)
검산 : 서울특별시청 위치(latitude=37.566788, longitude=126.978039) 와 부산시청 위치(latitude=35.180202, longitude=129.075388) 간의 거리계산을 위 공식에 대입하여 한번 계산해볼까요?
=> 그래서 위 도출된 좌표 간 거리에 대한 공식을 응용하여 이동중인 버스의 GPS 좌표와 정류장/정류소간 위치좌표를 활용하여 거리를 계산하는 것을 만들어서 영상으로 찍어봤습니다. 응용은 다양하겠죠.
- A 지점의 WGS84 좌표 위도(latitudeA_degree), 경도(longitudeA_degree)이라고 하고
- B 지점의 WGS84 좌표 위도(latitudeB_degree), 경도(longitudeB_degree)이라고 한다면
- 위도(緯度, 씨줄, Latitude)
- 적도를 기준으로 북쪽 또는 남쪽으로 얼마나 떨어져 있는지 나타내는 위치입니다.
- 북위(N)는 "+", 남위(S)는 "-" 로 다룹니다.
- 위도에서 가장 큰 값은 북위 90°와 남위 90°가 됩니다. (양 극으로 갈수록 위도가 높아집니다.)
- 위도 1°간의 거리는 균일합니다.
- 경도(經度, 날줄, Longitude)
- 본초 자오선을 기준으로 동쪽 혹은 서쪽으로 얼마나 떨어져 있는지 나타내는 위치입니다.
- 동경(E)는 "+", 서경(W)는 "-" 로 다룹니다.
- 경도간의 거리는 위도에 따라서 다릅니다. 극지방으로 갈수록 경도간의 거리는 짧아집니다. // 중요!!! 이 문제를 푸는데 이해되어야 하는 중요한 부분
- 지구의 반지름
- 극(極)반지름 : 약 6356700m
- 지구의 둘레(극 반지름 기준) = 2π x R ≒ 2π x 6356700m
- 적도(赤道, Equator)반지름 : 약 6378100m
- 지구의 둘레(적도 반지름 기준) = 2π x R ≒ 2π x 6378100m
- 지구를 타원형 지구로 바라보지 않고 완전히 둥근 구체로 추상화하였을 때 (즉, 극과 적도 반지름을 동일하게 가정하는 방법)
- 지구의 이심률(離心率, eccentricity)은 약 ≒ 0.0829 정도 (0에 가까울수록 원이며 0과 1사이 값이 타원, 쌍곡선은 1보다 크며 직선은 무한대)인데 이는 지구는 타원이기는 하지만 아주 미세한 타원이므로 그냥 원이라고 해도 무방하다는 관점의 도입이 크게 문제되지 않습니다.
- 지구의 둘레 = 2π x R ≒ 6371000m // 아래 풀이에서는 이 값을 사용하겠습니다.
- 극(極)반지름 : 약 6356700m
 [PNG image (231.08 KB)] |
![[https]](/moniwiki/imgs/https.png) 이미지 출처(wikipedia) 이미지 출처(wikipedia)![[]](/moniwiki/imgs/moni2/external.png) |
먼저 π rad = 180˚ 관계를 이용하여 degree 좌표를 radian으로 변환할 수 있습니다. (참고: 비율계산)
π rad : 180˚ = y rad : x˚
π rad * x˚ = 180˚* y rad
y rad = π rad * x˚/ 180˚

즉, radianY = degreeX * π / 180
latitudeA_radian = latitudeA_degree * π / 180.0
latitudeB_radian = latitudeB_degree * π / 180.0
longitudeDelta_radian = (longitudeA_degree - longitudeB_degree) * π / 180.0
distance = (sin(latitudeA_radian) * sin(latitudeB_radian)) + (cos(latitudeA_radian) * cos(latitudeB_radian) * cos(longitudeDelta_radian))
distance_meter = '지구의 둘레' * arccos(distance) ≒ 6371000m * arccos(distance)
latitudeA_radian = latitudeA_degree * π / 180.0 = 37.566788 * π / 180.0 ≒ 0.6556641399986955
latitudeB_radian = latitudeB_degree * π / 180.0 = 35.180202 * π / 180.0 ≒ 0.6140103564166941

longitudeDelta_radian = (longitudeA_degree - longitudeB_degree) * π / 180.0 = (126.978039 - 129.075388) * π / 180.0 ≒ -0.036605645613410696

distance = (sin(latitudeA_radian) * sin(latitudeB_radian)) + (cos(latitudeA_radian) * cos(latitudeB_radian) * cos(longitudeDelta_radian))
        ≒ (0.6096858037960656 * 0.5761499252816438) + (0.7926431862127784 * 0.8173440301353869 * 0.9993300881649553)
        ≒ 0.9986985960415217

distance_meter = '지구의 둘레' * arccos(distance)
        ≒ 6371000m * arccos(distance)
        ≒ 6371000m * arccos(0.9986985960415217)
        ≒ 6371000m * 0.051023256106557204
        ≒ 325069.1672582486m
        ≒ 약 325km
- 지도상에서 특정 위치의 WGS84 좌표를 얻고 싶으시면 지도 탐색(Map navigation) 를 사용해서 보실 수 있습니다.
- 당장 근처에 계산기가 없으시면 초 간단 계산기(Calculator) 를 사용해서 계산해보실 수 있습니다.
1.9. 참고링크
![[https]](/moniwiki/imgs/https.png) https://en.wikipedia.org/wiki/Trigonometric_functions
https://en.wikipedia.org/wiki/Trigonometric_functions![[]](/moniwiki/imgs/moni2/external.png)
![[https]](/moniwiki/imgs/https.png) https://en.wikipedia.org/wiki/Radian
https://en.wikipedia.org/wiki/Radian![[]](/moniwiki/imgs/moni2/external.png)
![[https]](/moniwiki/imgs/https.png) https://en.wikipedia.org/wiki/Degree_(angle)
https://en.wikipedia.org/wiki/Degree_(angle)![[]](/moniwiki/imgs/moni2/external.png)
![[https]](/moniwiki/imgs/https.png) https://calcproject.tistory.com/415
https://calcproject.tistory.com/415![[]](/moniwiki/imgs/moni2/external.png)
![[https]](/moniwiki/imgs/https.png) 수학 용어를 알면 개념이 보인다 - 092. 삼각비 vs 삼각함수 - 위키독스
수학 용어를 알면 개념이 보인다 - 092. 삼각비 vs 삼각함수 - 위키독스![[]](/moniwiki/imgs/moni2/external.png)
- 'co-' 는 complementary 로, 여각(complementary angle)을 뜻한다
- arc는 호라는 뜻인데, 호도법(라디안)에서 호로 각을 표현하므로, 여기서는 각을 뜻한다
- 여각 | 餘角 | complementary angle
- 여는 잉여, 나머지라는 뜻이다. 여집합에 쓰인 한자이다. 직각(90도)을 전체로 놓고, 이때 부족한 크기의 각이 여각이다. 30도의 여각은 60도이다. 반대로, 60도의 여각은 30도이다.
- 보각 | 補角 | supplementary angle
- 보는 보조, 돕다, 보태다의 뜻이다. 보수에 쓰인 한자이다. 평각(180도)을 전체로 하고, 이때 부족한 각의 크기가 보각이다. 30도의 보각은 150도이다. 반대로 150도의 보각은 30도이다.
- π값의 소수점 아래 1,000 자리 수는 다음과 같습니다.
3.1415926535 8979323846 2643383279 5028841971 6939937510 5820974944 5923078164 0628620899 8628034825 3421170679
  8214808651 3282306647 0938446095 5058223172 5359408128 4811174502 8410270193 8521105559 6446229489 5493038196
  4428810975 6659334461 2847564823 3786783165 2712019091 4564856692 3460348610 4543266482 1339360726 0249141273
  7245870066 0631558817 4881520920 9628292540 9171536436 7892590360 0113305305 4882046652 1384146951 9415116094
  3305727036 5759591953 0921861173 8193261179 3105118548 0744623799 6274956735 1885752724 8912279381 8301194912
  9833673362 4406566430 8602139494 6395224737 1907021798 6094370277 0539217176 2931767523 8467481846 7669405132
  0005681271 4526356082 7785771342 7577896091 7363717872 1468440901 2249534301 4654958537 1050792279 6892589235
  4201995611 2129021960 8640344181 5981362977 4771309960 5187072113 4999999837 2978049951 0597317328 1609631859
  5024459455 3469083026 4252230825 3344685035 2619311881 7101000313 7838752886 5875332083 8142061717 7669147303
  5982534904 2875546873 1159562863 8823537875 9375195778 1857780532 1712268066 1300192787 6611195909 2164201989
  ...
- 유클리드의 '원론' 2권 명제 12 및 명제 13 은 코사인 법칙과 동치인 명제를 서술하고 있다고 합니다.
- 명제12
둔각 삼각형에서, 둔각을 마주하는 변 위의 정사각형은 둔각을 이루는 변들 위의 정사각형들(의 합)보다 수직 (직선)이 내려진 둔각의 변, 그리고 둔각을 향한 수직 (직선)에 의해 (삼각형의) 밖에서 절단된 (직선)이 이루는 (직사각형)의 두 배만큼 많다.
Proposition 12†
In obtuse-angled triangles, the square on the side subtending the obtuse angle is greater than the (sum of the) squares on the sides containing the obtuse angle by twice the (rectangle) contained by one of the sides around the obtuse angle, to which a perpendicular (straight-line) falls, and the (straight-line) cut off outside (the triangle) by the perpendicular (straight-line) towards the obtuse angle.
- 명제13
예각 삼각형에서, 예각을 마주하는 변 위의 정사각형은 예각을 이루는 변들 위의 정사각형들(의 합)보다 수직 (직선)이 내려진 예각의 변, 그리고 예각을 향하는 수직 (직선)에 의해 (삼각형의) 안에서 절단된 (직선)이 이루는 (직사각형)의 두 배만큼 적다.
Proposition 13†
In acute-angled triangles, the square on the side subtending the acute angle is less than the (sum of the) squares on the sides containing the acute angle by twice the (rectangle) contained by one of the sides around the acute angle, to which a perpendicular (straight-line) falls, and the (straight-line) cut off inside (the triangle) by the perpendicular (straight-line) towards the acute angle.
- 명제12
- NMEA 0183 (시간, 위치, 방위 등의 정보를 전송하기 위한 규격)
- 3차원 그래픽
- 비율계산
[깨봉수학] 초등학교 때 수학 이렇게 배웠으면... (feat. 삼각함수, Sine) 참고 영상
삼각비 - 수악중독 참고 영상
일반각 - 수악중독 참고 영상
호도법 - 수악중독 참고 영상
두 동경의 위치 관계 - 수악중독 참고 영상
삼각함수 - 수악중독 참고 영상
삼각함수 사이의 관계 - 수악중독 참고 영상
삼각함수의 그래프 - 수악중독 참고 영상
삼각함수 덧셈정리 - 수악중독 참고 영상
광속의 신비 - 광속은 왜 불변일까? - DMT PARK 참고 영상 시공간 축의 변환, 로렌츠 변환, 허수등...
